Crude oil posted solid gains on Tuesday. Brent rose by about 1.8 percent whereas the same contract on WTI closed by 2.1 percent higher. The price of oil was supported by weakening U.S. dollar (see the chart). TransCanada Corp, an operator of the Keystone pipeline (which brings crude from Canada’s oil sands to Cushing) said yesterday it would take few more days to put the pipeline back to operation. The pipeline which, was opened in February this year, reported a small leak at one of its pumping stations on Sunday.
A set of data recently released in both U.S. and China surprised on the downside. Hence, we still maintain our view that the average price of Brent in this quarter might be 115 USD per barrel.
Metals
Even though that freshly released China’s PMI surprised slightly on the downside, lingering worries related to the stance of China’s monetary policy overshadowed a positive influence of weakening U.S. dollar and copper price slightly decreased today in the morning.
Let us remind that the Public Bank of China has already increased a required reserves ratio by 250 basis points this year and official interest rates are 50 bps higher than they were at the end of last year.
Chart of the day: USD vs WTI
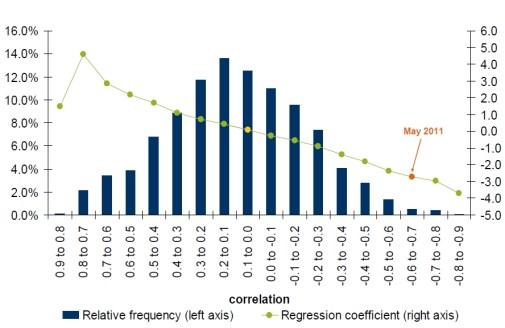
The picture shows relationship of daily percentage change of the trade weighted U.S. dollar (DXY) and U.S. crude WTI.
We calculated rolling correlations (period 20 trading days) and we split them into intervals by 0.1. For each interval we calculated a simple regression (percentage change in the price of oil dependent on the percentage change in DXY and the constant term).
The chart suggests that the higher correlation between DXY and WTI, the stronger movement of price of oil might be expected in the case of the same change in DXY. For example, in May 2011, the rolling correlation between the two has been on average about -0.7. Hence, one could expect that 1 percent change in DXY should be on average accompanied by 2.7 percent change in the price of oil (let us remind that we are not suggesting there is a clear causality between the two, oil might determine DXY as well as DXY might determine the price of oil).
The chart also says that the relationship is fairly symmetric in a sense that in periods of high positive correlation is more or less the same as in the periods of the negative correlation of the same magnitude (in absolute values). The only statistically insignificant relationship between the price of WTI and DXY is marked by yellow point.
The chart also suggests that in about two thirds of
sessions, the correlation between changes of oil price and DXY remains between -0.3 and 0.3, which suggests approximately one-to-one relationship.